The Process That Kept Dying
Jul 21, 2024
A memory leak murder mystery
This article is an adaptation of a talk I gave as part of our companies “Lunch n’ Learn” education series.
If you’re mostly interested in how to find a memory leak in Node, skip to Part 2 (but you will miss my incredible worldbuilding).

This is the story of a process that died, and the tale of what we went through to track down the killer and bring it to justice. More accurately, it was a process that kept dying, but that hurts the analogy I’m trying to go for here so just bear with me.
Our story begins with an intermittent 502 Bad Gateway error - a mystery just waiting to be solved.
The names and locations have been changed to protect the innocent.
Part 1: The Discovery
It was a rainy night in the city, the kind where neon signs shimmer like broken dreams. Charlie, an SRE from a large crowdfunding site, walked into my office, looking like he hadn’t slept in days. His face was pale, his eyes bloodshot. “I’ve got a problem, Detective,” he said, voice husky. “502s. Bad gateway errors. They’re tearing our system apart.”
I leaned back, letting smoke curl up toward the ceiling. “502s, huh? Could be a bad upstream server, a faulty load balancer, or network issues. You sure you’ve checked all the usual suspects?”
Charlie nodded, fingers drumming on my desk. “I’ve checked everything. It’s like a ghost in the machine.”
I looked him over and weighed his desperation. “Alright, Charlie. I’ll take the case. But remember, the truth might not be what you want to hear. There could be a killer in your midst.”
As he left, I grabbed my coat. It was time to dive into the murky depths of the network, where signals got lost, and errors lurked like shadows.
The 502 errors were concerning. Each 502 represented someone who was trying to visit our site but being served an error message instead. Although the actual error rate was still relatively low, these errors could be the difference between someone hitting their goal and not getting the help they need. Working in the crowdfunding space means having a real responsibility to your users.
The Investigation
Like any good detective, I started by gathering clues. We have all of our applications wired up with both New Relic and Sumologic, but for this kind of thing I find that Sumologic is the better tool for getting a picture of the problem. I was able to determine the following:
- History: Errors traced back to at least three months.
- Frequency: Occurrences every 3-4 hours.
- Scope: Limited to the Next.js application.
- Impact: Serious enough to trigger PagerDuty alerts.

We had made some pretty big architectural changes recently, including switching to Next.js and a couple of Node updates. But by getting an accurate timeline we could rule those out as culprits.
PM2 - The Likely Culprit?
The first suspect was PM2, a daemon process manager for Node. I never trusted PM2. It had a way of masking problems, making everything look fine until it wasn’t. It was too smooth, too polished, like a con artist in a silk suit.
I decided to pay PM2 a visit. The logs were a mess, as expected. Red herrings and dead ends everywhere. But then, a single log entry caught my eye. It indicated a process exceeding its memory limit, suggesting that Next.js was using too much memory. PM2 was the one pulling the trigger, restarting processes and causing those 502 errors.
I called Charlie. “I can’t be certain, but I think I found your killer. It goes by the name PM2.”
PM2 (Process Manager 2) is a production process manager for Node.js applications. It allows you to keep applications alive forever, reload them without downtime, and facilitate common system admin tasks. PM2 can perform automatic restart of applications if they crash, or in this case, they start to run out of memory.
Armed with the knowledge that PM2 was killing the process we adjusted the max_memory_restart parameter in our PM2 config, hoping that it was just an issue with resourcing. We crossed our fingers and pushed it live. We would have our answer within a day or two.
Part 2: The Hunt for the Leak
Charlie called me late one night, his voice edged with desperation. “Your fix didn’t work, Detective. The 502s are still here. PM2 is killing servers left and right.”
I sighed, rubbing my temples. “Alright, Charlie. This is bigger than a quick fix. Your Next.js app is leaking memory, and it’s going to take some serious digging to find the source.”
Charlie’s frustration was palpable. “So, what do we do now?”
“We’ll need to dive into the code,” I replied. “Identify the leaks and patch them up. This is going to be a long haul, Charlie. Memory leaks can be like trying to find a needle in a haystack.”
He sighed heavily. “Alright, Detective. Let’s get to work. We can’t afford to keep bleeding users.”
The rain had turned into a relentless downpour, matching the mood inside my office. I knew this was just the beginning. Tracking down a memory leak was no small task, and it was going to take all the skills I had. But I’d been down this road before. I’d find the culprit, one way or another. In this city, you had to, or you’d drown in the deluge of your own mistakes.
Increasing the resources available to our application didn’t fix things. We determined that the server process would just consume more and more memory as time went on, eventually needing to be restarted. It was definitely a memory leak.
The Memory Leak Blues
Memory leaks can be difficult and time consuming to debug. Fortunately the tooling that exists today is excellent. The steps look something like this:
- Start application and enable debugging
- Snapshot the heap
- Load testing
- Take another snapshot
- Compare the two
![]()
1. Inspecting The Application
My first attempt at inspecting the application was a simple NODE_OPTIONS='--inspect' yarn start. However after several puzzling heap snapshots I realized that this was inspecting the wrong process. The NODE_OPTIONS were only applying to the yarn process, not the underlying Next.js server that was being invoked by yarn. I was able to identify the process ID (pid) of the Next.js server with a simple ps aux | grep node.
To enable debugging on a running Node process, you can run kill -USR1 {pid}. This sends a signal to the Node process to begin listening for the debugger.
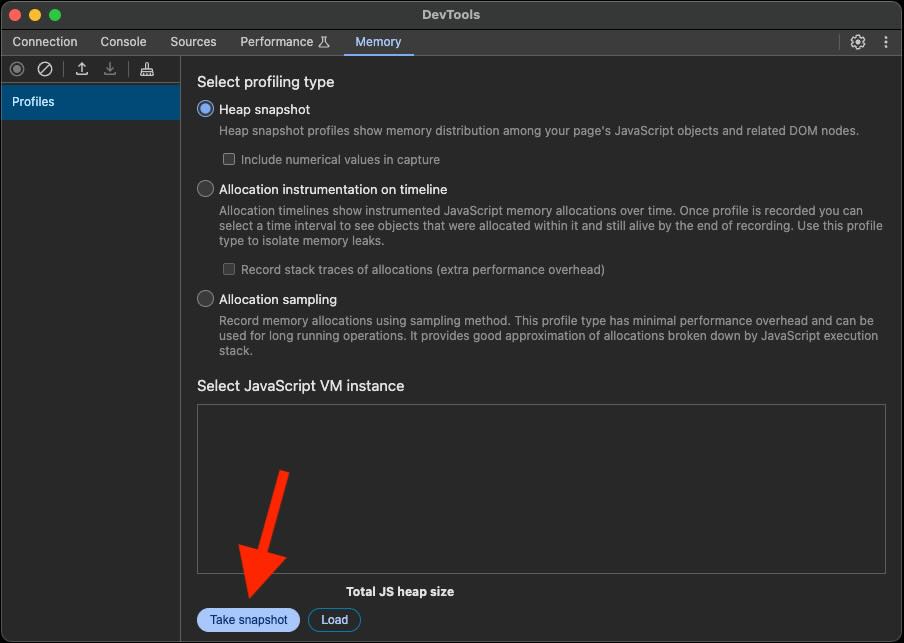
2. Taking A Snapshot
Open up your Chrome debugger by navigating to chrome://inspect. Go to the “Memory” tab, and click “Take Snapshot”.
3. Load testing
Now that we have a baseline, we need to see the leak in action. I ran this script to dispatch a few hundred requests to the server:
4. Take a second snapshot
This time, select the circular “Record” button on the upper left part of the window.
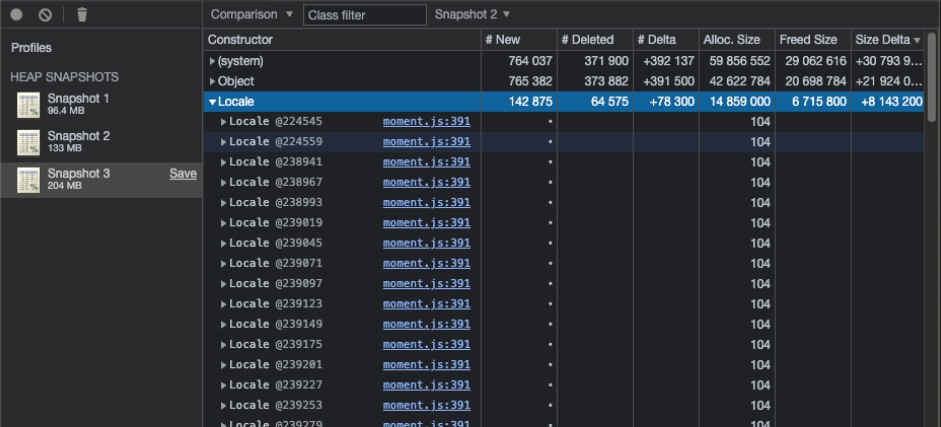
5. Compare the snapshots
All that’s left is to compare the snapshots and see if anything seems suspicious. You should see a dropdown that says “Summary”. Change this to “Compare”, then sort the table by “Size Delta”. If you’re lucky, your problem might just be staring you in the face at this point.
Final Part: Identifying the Culprit
We spent days gathering intel. Finally, with a pile of blurry snapshots spread out across my desk the true killer jumped out at me. “Hey Charlie,” I called. “Anything look funny in this snapshot to you?”
Charlie stared. “I don’t see it?”
“It’s Moment.js. It’s bleeding memory like a stuck pig.”
Charlie sounded both relieved and exhausted. “So, what do we do now?”
“There’s just one more piece of this puzzle. We know Moment.js is the killer, but we still need to find the murder weapon”
Moment.js - The Prime Suspect
After digging in, we found that calls to moment.updateLocale were causing memory leaks. After determining that the issue was not in any of our code, we took a look at the Moment.js repo and found out there was already a solution to our problem. Updating Moment.js from version 2.24.0 to 2.29.4 completely resolved the memory leak issue and made the 502 errors disappear.
Epilogue
As Charlie left my office, I glanced out the window. The rain had finally stopped, and the first hints of dawn were breaking through the clouds. This case was closed, but there’d be more. There always were. In this city, there’s no shortage of problems waiting to be solved. But for now, I could take a breath and enjoy the calm before the next storm rolled in.
Original presentation used assets from Slidesgo, including icons by Flaticon and infographics & images by Freepik
Share